Together AI AI technology page Top Builders

Explore the top contributors showcasing the highest number of Together AI AI technology page app submissions within our community.

Together AI: Powering AI Innovation

Together AI is AI cloud platform which drives AI innovation. It contributes to open-source research, empowering developers to deploy AI models.

General
AuthorTogether AI
TypeAI platform

Key Features

  • Unmatched performance: Its research and developments introduce advanced efficiencies in training and inference processes which grows along with user's requirements. The Together Inference Engine has the swiftest inference stack currently available.
  • High scalability: It is a horizontally scalable platform which is delivering peak performance based on user's traffic demands.
  • Rapid integration: Integrates into existing applications with minimal setup with its easy-to-use API.
  • Topnotch support: Their expert team is there to assist users in the preparation and optimization of datasets to ensure accuracy and providing support in training personalized AI models.

Start building with Together AI's products

Dive into the possible solutions from Together AI to ensure flawless building of your app. Explore the apps created with Together AI technology showcased during hackathons and innovation challenges!

List of Together AI's products

Together Inference

Together Inference is the fastest inference stack available, delivering speeds up to 3 times faster than competitors like TGI, vLLM, or other inference APIs such as Perplexity, Anyscale, or Mosaic ML. Run leading open-source models like Llama-2 with lightning-fast performance, all at a cost 6 times lower than GPT 3.5 Turbo when using Llama2-13B.

Together Custom Models

Together Custom Models is designed to assist you in training your own advanced AI model. You can use state-of-the-art optimizations for the better performance in the Together Training stack, such as FlashAttention-2. Once completed, the model belongs to you. Also, you will be able to maintain the whole ownership of the model and deploy it wherever you want to.

Together GPU Clusters

Together AI provides top-performing computing clusters designed for training and refining purposes. Their clusters come equipped with the lightning-fast Together Training stack, ensuring seamless operation. Additionally, their AI experts team of is readily available to offer any kind of assistance. With a renewal rate higher than 95%, Together GPU Clusters ensure reliability and performance.

System Requirements

Together AI is compatible with major operating systems, including Windows, macOS, and Linux. A minimum of 4 GB of RAM is recommended for optimal performance. Complimentary is having access to a GPU can which significantly enhances performance of model training.

Together AI AI technology page Hackathon projects

Discover innovative solutions crafted with Together AI AI technology page, developed by our community members during our engaging hackathons.

LafeAINet

LafeAINet

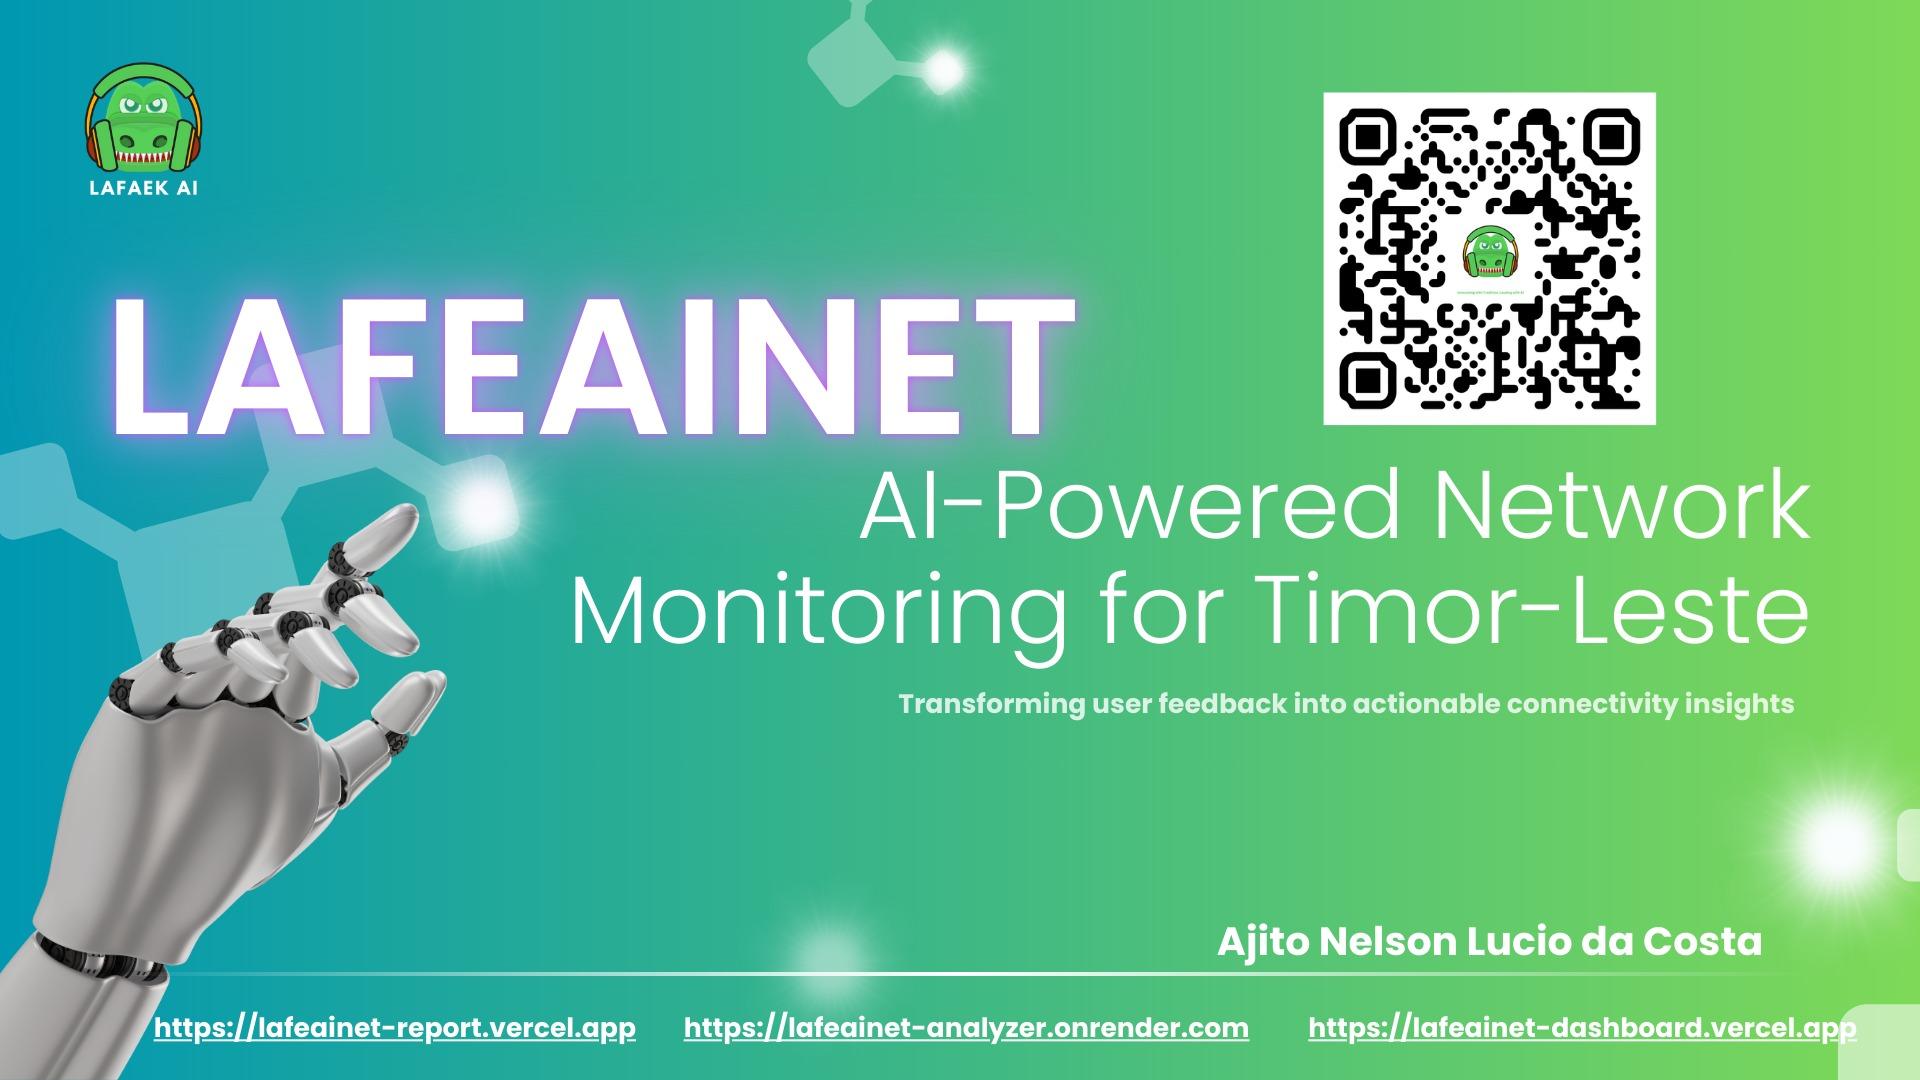
LafeAINet is a comprehensive network monitoring platform designed to address connectivity challenges in Timor-Leste. Our solution transforms scattered social media complaints into structured, actionable data through three integrated components. LafeAINet-Report provides a simple mobile-friendly interface for citizens to submit network quality reports, automatically capturing speed, location, and provider data. LafeAINet-Analyzer processes these reports using Llama 3.3 70B AI to generate quality scores and sentiment analysis. LafeAINet-Dashboard visualizes this data through interactive maps and provider comparisons, revealing connectivity gaps across regions. By creating transparency and accountability in telecommunications infrastructure, LafeAINet empowers multiple stakeholders: citizens gain a voice in service improvement, providers identify priority areas for network enhancement, and government officials access evidence for policy decisions. The platform's user-friendly design ensures accessibility even in low-connectivity areas, encouraging widespread participation. Our solution addresses a critical development barrier in Timor-Leste, where reliable internet is essential for education, healthcare, business, and government services. Through data-driven insights, LafeAINet contributes to more equitable digital access, supporting the nation's broader economic and social development goals while creating a replicable model for other emerging markets facing similar connectivity challenges.

NetConnect

NetConnect

Public Sector Network Connectivity Analyzer The Public Sector Network Connectivity Analyzer is a comprehensive solution designed to address the critical need for reliable network monitoring across public institutions. Our application serves as an essential tool for IT administrators managing connectivity infrastructure for schools, healthcare facilities, government offices, libraries, and other public service organizations. Core Capabilities Real-Time Network Visualization Interactive diagrams and topology maps provide clear visibility into how public institutions are connected, displaying network elements, connection points, and infrastructure components with intuitive visualization tools. Performance Monitoring System Our platform continuously tracks vital network metrics including uptime percentages, latency measurements, bandwidth utilization, and connection status across the entire public sector network, enabling proactive management. Advanced Simulation Engine IT professionals can run comprehensive simulations to test network resilience under various scenarios such as increased user loads, infrastructure failures, or cyber incidents, helping identify vulnerabilities before they impact critical services. Institution Management Portal Administrators can efficiently manage information about connected institutions, monitor their connection status in real-time, and access detailed performance metrics through a unified dashboard interface. Geographic Mapping Integration Our system incorporates geographic visualization capabilities to display the physical distribution of institutions and network infrastructure across regions, facilitating better resource allocation and planning. Technical Implementation This solution addresses the unique challenges faced by public sector organizations that require reliable connectivity for delivering essential services to communities, while providing the tools needed to ensure network resilience, performance, and security.

Network traffic anomaly and congestion prediction

Network traffic anomaly and congestion prediction

Network Anomaly Detection & Congestion Prediction System This tool is designed to help you analyze and visualize your network traffic data to identify unusual patterns (anomalies) and predict potential network congestion. Whether you’re a network admin, a data scientist, or simply curious about traffic analysis, this app has you covered. Key Features: Anomaly Detection: Identify abnormal network traffic based on various metrics like packet length, protocol type, and time. Congestion Prediction: Predict potential network congestion by analyzing traffic patterns and detecting anomalies. Interactive Visualizations: Stunning charts and graphs for a more insightful analysis of the data, anomalies, and congestion. Technologies Used: Streamlit: The backbone of this web app, providing an interactive and easy-to-use interface. Pandas: For data manipulation and analysis of the network traffic data. NumPy: For numerical operations and data transformations. Plotly: Interactive and dynamic visualizations like histograms, scatter plots, and pie charts. Scikit-learn: Machine learning models like Isolation Forest for anomaly detection and congestion prediction. Python: The main programming language behind the app’s backend logic. Steps to Use: Step 1: Upload your network traffic data (CSV format). Step 2: Run Anomaly Detection to detect abnormal traffic patterns. Step 3: Predict Network Congestion based on detected anomalies. Visual Enhancements: Anomaly Distribution: A histogram to visualize how many records are normal and how many are anomalous. Anomalies Over Time: Scatter plot shows anomalies in relation to the time of day. Anomaly vs Normal: A pie chart to compare the number of normal vs anomalous records.