
Abdullah Jameel@AbdullahBhatti308
20
Events attended
15
Submissions made
Pakistan
1 year of experience
About me
Software Engineer. Passionate about AI/ML. 5x Hackathon Winner. Participate in almost 30+ Hackathons. Always open to experiment new things. Feel free to chat. LinkedIN: https://www.linkedin.com/in/abdullahjameel94/ GitHub: https://github.com/abdullahxyz85
🤝 Top Collaborators


🤓 Latest Submissions

MarketScout AI
MarketScout AI is an autonomous multi-agent platform built for the AMD Developer Hackathon Act II to help entrepreneurs, researchers, innovators, and investors validate startup ideas faster and make data-driven decisions with confidence. Validating a startup idea typically requires hours or days of manual research across competitor websites, scientific publications, patent databases, funding platforms, and market reports. This fragmented process slows innovation and makes it difficult to identify truly promising opportunities. MarketScout AI solves this challenge through a team of 12 autonomous AI agents that collaborate to automate the entire validation workflow. Starting from a single startup idea, the platform performs competitor analysis, scientific literature review, patent discovery, funding research, market trend analysis, research gap identification, innovation scoring, business validation, strategic planning, knowledge graph generation, and automated report creation. The platform delivers an interactive dashboard with competitor insights, market opportunities, SWOT analysis, funding recommendations, innovation scores, strategic guidance, and a visual knowledge graph that connects technologies, research, competitors, and investments into one unified view. Powered by Fireworks AI running advanced large language models on AMD Cloud Infrastructure with AMD Instinct GPUs, and built using Next.js and Tailwind CSS, MarketScout AI provides fast, scalable, and autonomous AI reasoning. As part of the Expected Unicorn Track, our vision extends beyond validating ideas. We aim to help founders discover high-potential, billion-dollar startup opportunities by combining autonomous AI research with actionable business intelligence. MarketScout AI acts as an AI startup co-pilot, reducing research time from days to minutes while helping innovators identify market gaps, evaluate opportunities, and build the next generation of unicorn startups.
13 Jul 2026
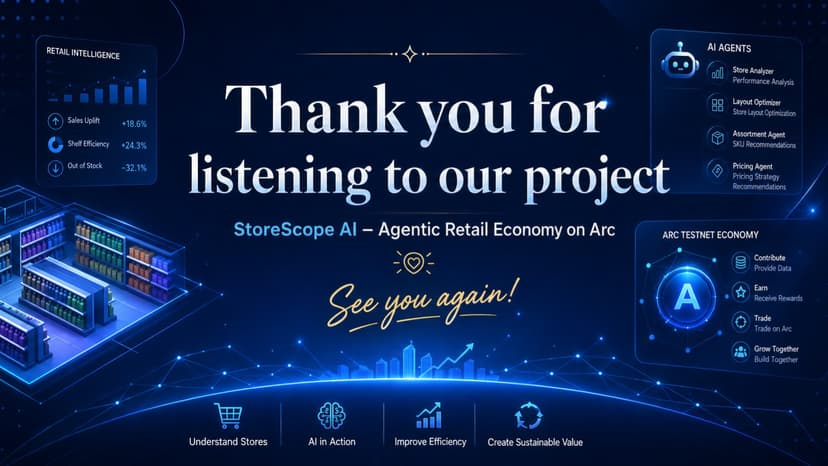
StoreScope AI – Agentic Retail Economy on Arc
StoreScope AI is an AI-powered FMCG retail intelligence platform built for the Agentic Economy on Arc. The project helps retail teams, distributors, category managers, and FMCG professionals analyze store images, understand product visibility, detect stock risks, compare competitor presence, and generate actionable reports. Beyond image analysis, StoreScope AI also provides a store layout simulation space where users can create their own store models, place shelves, coolers, checkout counters, promotion islands, and product zones. These layouts help managers understand which display positions are most effective and how store structure can impact sales performance. The platform also introduces a community marketplace and FMCG forum where users can share layouts, reports, and practical retail experience. User-created layouts can become digital assets that may be shared or traded within the community. On Arc Testnet, StoreScope AI uses USDC nanopayments to support small AI tasks, premium reports, layout templates, and agent-powered services. The goal is to create more than an application: a professional FMCG ecosystem where AI agents, retail knowledge, and digital payments work together.
26 Apr 2026

Qubic TAP TAP Miner with Nostromo Launchpad
QUBIC TAP TAP MINER IS A FIRST QUBIC BLOCKCHAIN MINING GAME WHICH ALLOWS YOU TO MINE 1000 QUBIC COIN PER TAP AND LET YOU STAKE SWAP OR WITHDRAW ON YOUR OWN REQUIREMENT AND DEMAND YOU CAN EASILY SWAP IT TO ANY OTHER TOKEN VIA DEFI TRADING USING META MASK OR SEND IT TO YOUR PEER FROM COMMUNITY PAY BACK P2P TRADE AND SEND SYSTEM USING Nostromo LAUNCHPAD PROTOCOL How Nostromo Works Users earn QUBIC through tap-to-earn gaming, staking on launchpad, and referrals, then maximize returns using DeFi features like token swaps, liquidity pools, yield farming, and lending protocols. STEP 1 Tap & Earn Tap to mine QUBIC tokens instantly STEP 2 Stake Lock tokens to earn high APY rewards STEP 3 Refer Invite friends and earn bonus rewards STEP 4 DeFi Trading Swap, farm, and lend for maximum yield STEP 5 Spend Redeem gift cards with your earnings STEP 6 Grow Wealth Compound returns and scale profits Pro Tip: Stake your earned QUBIC in the Nostromo Launchpad for passive income, then use DeFi to multiply your returns through yield farming and liquidity provision!
7 Dec 2025

Shadow Mentor
The Shadow Mentor is an AI-driven solution built on IBM Watsonx that tackles the significant HR problem of "Post-Onboarding Ghosting". This refers to the critical gap that emerges after the first week of employment, where new hires feel lost and productivity drops because managers cease constant hand-holding. The agent serves as an Invisible Onboarding Companion, ensuring continuous and personalized functional and cultural integration for the new hire.The system operates based on a constant Perceive , Decide , Act loop. It Perceives by using Watsonx Skills (Calendar, Slack, HRIS read access) to scan the employee's activity and identify "Integration Gaps" (e.g., no manager 1:1, or failure to access a core code repository). It then Decides the necessary intervention by consulting its knowledge base, which includes features like matching the user with their certification path/roadmap and confirming their role (Junior/Senior). Finally, it Acts discreetly, either by ghost-booking a 15-minute check-in on the manager's calendar with talking points or by sending a personalized Slack DM to the new hire with direct links for tasks like setting up a 401k.Crucially, the Shadow Mentor offers Intelligent Provisioning by assigning a pre-configured, role-specific initial project. This is central to Performance Tracking, which includes scoring and Tests with 3 retakes before certificate enrollment. Additional features include a smart calendar with a predictive clock and a switch for Active/Manual scheduling. By connecting enterprise systems intelligently, the Shadow Mentor transforms the risk of abandonment into a powerful opportunity for seamless, productive, and supported employee integration from day one.
23 Nov 2025

AI Supply Guardian-Smart Risk Alerts for SMEs
AI Supply Guardian is a lightweight, AI-powered assistant designed to help small and medium businesses stay ahead of supply chain risks. Many SMEs struggle with delayed shipments, sudden price changes, and the constant need to manually monitor supplier emails or updates. Our tool solves this by analyzing supplier messages, order details, and user-provided inputs to detect potential delays or cost shifts in real time. The system provides clear risk levels, actionable recommendations, and a clean dashboard where businesses can track every supplier at a glance. With quick alerts and simple workflows, AI Supply Guardian empowers teams to take faster, smarter decisions, without needing complex ERP systems or technical expertise. It’s practical, easy to adopt, and built to make supply management more predictable and stress-free.
19 Nov 2025

AI Job Application Agent-Smarter Job Hunting
Searching and applying for jobs is often a tiring and repetitive process. Candidates spend countless hours scanning job boards, adjusting resumes, and drafting cover letters, which can be overwhelming and inefficient. Many great opportunities are missed simply because people cannot keep up with the workload. Our project tackles this by building an AI Job Application Agent powered by a modular multi-agent system. Each agent has a dedicated role: parsing resumes, searching job listings through APIs, ranking positions based on profile fit, and generating personalized cover letters with an LLM. A lightweight user interface ensures that candidates remain in control, they can review, approve, and decide whether to submit applications. The design emphasizes transparency and accountability, with every step logged. By combining automation with a user-in-the-loop approach, we make job applications both smarter and more efficient. Beyond the hackathon, the system can evolve into a premium service with integrations for LinkedIn, ATS platforms, multilingual support, and adaptive feedback loops that learn from successful applications. In short, our solution makes job hunting less stressful and more strategic, helping candidates focus on opportunities that truly matter.
21 Sep 2025

AI Legal Support with LegalVision
LegalVision is an AI-driven platform designed to make legal knowledge accessible, clear, and actionable for everyone. In today’s world, understanding laws, rights, and legal documents can feel overwhelming. Most people either spend large amounts of money on legal consultations or struggle with jargon-filled documents that leave them confused. This creates a major gap between citizens and the justice system. LegalVision bridges that gap by acting as a real-time AI legal assistant. Users can upload or input complex legal texts, contracts, or queries, and LegalVision instantly transforms them into simple, human-friendly explanations. Instead of spending hours trying to decode legal terms, people receive clear answers in seconds. Key features include: ● Simplified Legal Language: Converts legal jargon into everyday words. ● Real-Time Assistance: Provides instant responses to user questions. ● Interactive Guidance: Offers step-by-step support for common legal processes. ● Accessibility: Designed for individuals, small businesses, and communities who cannot afford expensive legal advice. By making legal information affordable, understandable, and accessible, LegalVision empowers people to make informed decisions and protects them from exploitation caused by lack of knowledge. Our vision is to create a future where justice is not limited to those who can pay for it, but a right that everyone can access easily. LegalVision is not just a tool, it is a bridge between citizens and justice, ensuring no one is left behind in navigating the law.
24 Aug 2025
CodeSage-AI Code Review Tool
This project is a fully open-source AI application that automates the process of reviewing code changes in GitHub pull requests. It uses the power of BLACKBOX.AI’s Coding Agent and leverages Groq’s high-speed inference capabilities to run LLaMA models by Meta for analyzing code diffs and generating insightful, natural-language review comments. Built to enhance developer productivity, the tool seamlessly integrates with GitHub, scans PRs for changes, and offers intelligent suggestions including bug detection, optimization tips, and documentation prompts all within seconds. It features a clean, user-friendly interface that supports both GitHub-connected workflows and manual code review for standalone snippets. By combining ultra-low latency inference (via Groq) with sophisticated language modeling (via LLaMA), this tool aims to reduce review time, increase code quality, and make collaborative development more efficient for teams of all sizes.
8 Jul 2025

SynthoCode
SynthoCode is a powerful, web-based collaborative Integrated Development Environment (IDE) that enables multiple users to work together on coding projects in real time. With features like synchronized code editing, live chat, real-time cursor sharing, and integrated terminal access, it provides a seamless team programming experience. It supports multiple programming languages, syntax highlighting, and execution of code directly in the browser. Built using modern web technologies such as Node.js, Express, and WebSocket, SynthoCode promotes efficient teamwork and learning, especially in remote or educational environments. Whether you're pair programming, conducting interviews, teaching coding, or collaborating on open-source projects, SynthoCode simplifies remote development like never before. Features Multiple users can join a room and edit code together Changes are reflected in real time Copy button to copy the room id to clipboard Leave button to leave the room Supports syntax highlighting for different programming languages Users can choose theme based on their preferences Users can leave the room and rejoin later to continue editing Joining & leaving of users is also reflected in real time
15 Jun 2025


