Hero Banner

Top Builders

Explore the top contributors showcasing the highest number of app submissions within our community.

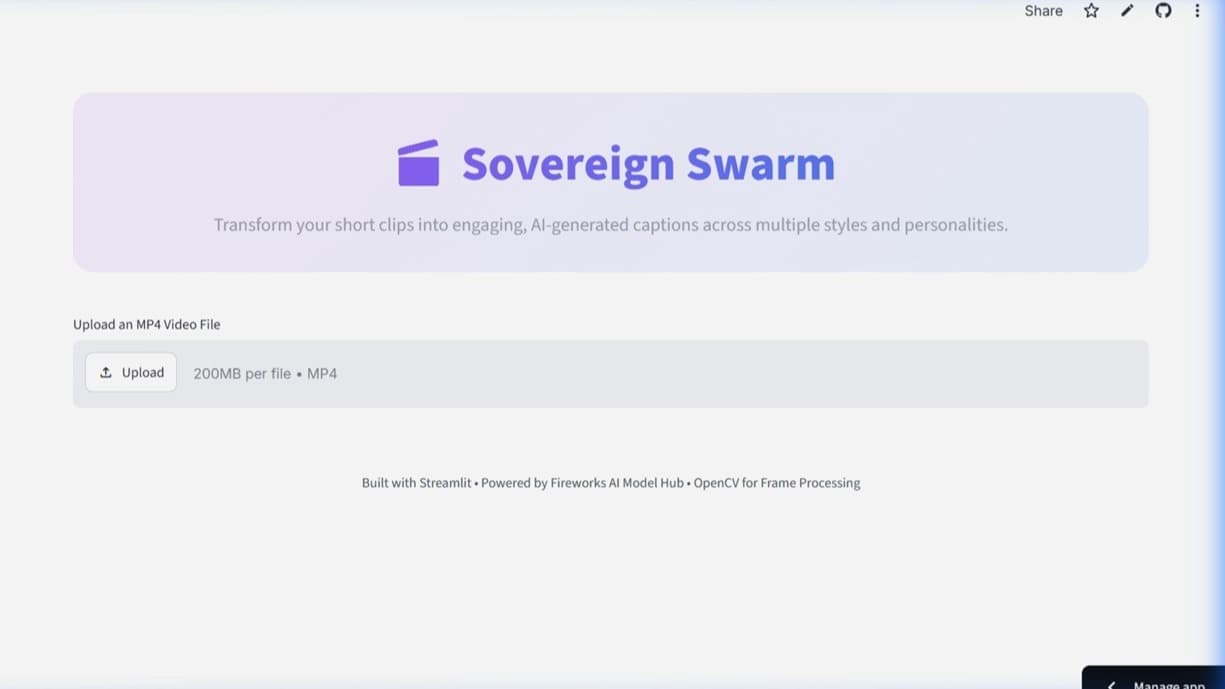
Streamlit: Effortless Front-Ends for Your Data Apps

Streamlit is a pioneering technology provider that specializes in turning data scripts into shareable web apps with minimal effort. Launched in 2018, Streamlit has gained popularity for its ease of use and efficiency, empowering data scientists and developers to create and deploy data-driven applications swiftly.

General
AuthorStreamlit
Repositoryhttps://github.com/streamlit/streamlit
TypeFramework for ML and data science apps

Key Features

  • Transforms Python scripts into interactive apps with simple annotations, dramatically reducing development time.
  • Facilitates real-time interactivity directly from Python code without requiring front-end expertise.
  • Supports hot-reloading, allowing instant app updates as the underlying code changes.
  • Provides built-in support for a wide array of widgets, enabling the addition of interactive features without additional coding.

Start building with Streamlit's products

Streamlit offers a range of features designed to simplify the process of app creation and deployment, enhancing productivity in data science and machine learning fields. Explore how you can leverage Streamlit to turn your data projects into interactive applications. Don’t forget to check out the innovative projects built with Streamlit at various tech meetups!

List of Streamlit's products

Streamlit Library

The Streamlit Library allows developers to quickly convert Python scripts into interactive web apps. This library is packed with easy-to-use functionalities that make it straightforward to add widgets, charts, maps, and media files, transforming complex data science projects into user-friendly applications.

Streamlit Sharing

Streamlit Sharing provides the hosting infrastructure to share Streamlit apps with the world. It simplifies deployment, enabling users to go from script to app in minutes on a secure and scalable platform.

Streamlit for Teams

Streamlit for Teams is designed for collaboration and enterprise usage, offering additional features like integration with existing databases, advanced security protocols, and customized control for managing user access and data privacy.

System Requirements

Streamlit is compatible with Linux, macOS, and Windows systems, requiring Python 3.6 or later. It typically runs with minimal hardware requirements, though performance scales with available resources. For optimal performance, a modern processor and sufficient RAM are recommended, with a stable internet connection for deploying apps using Streamlit Sharing. Modern browsers with JavaScript support are required to view and interact with the apps.
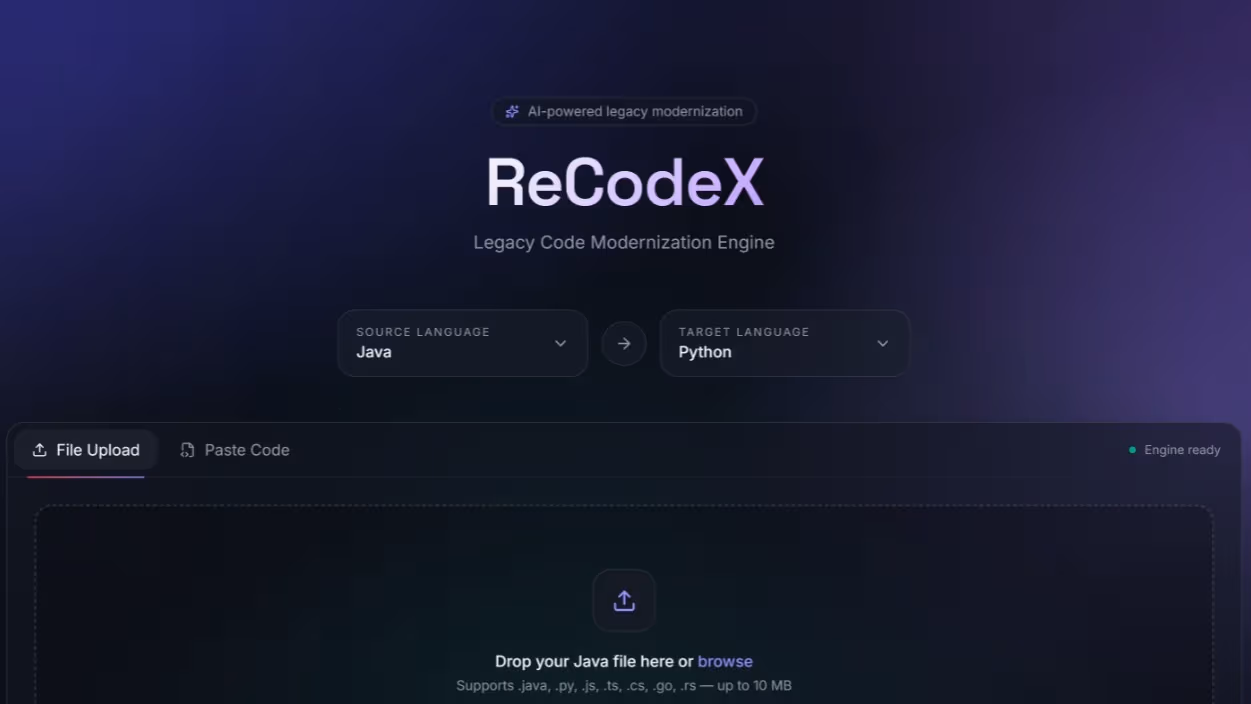
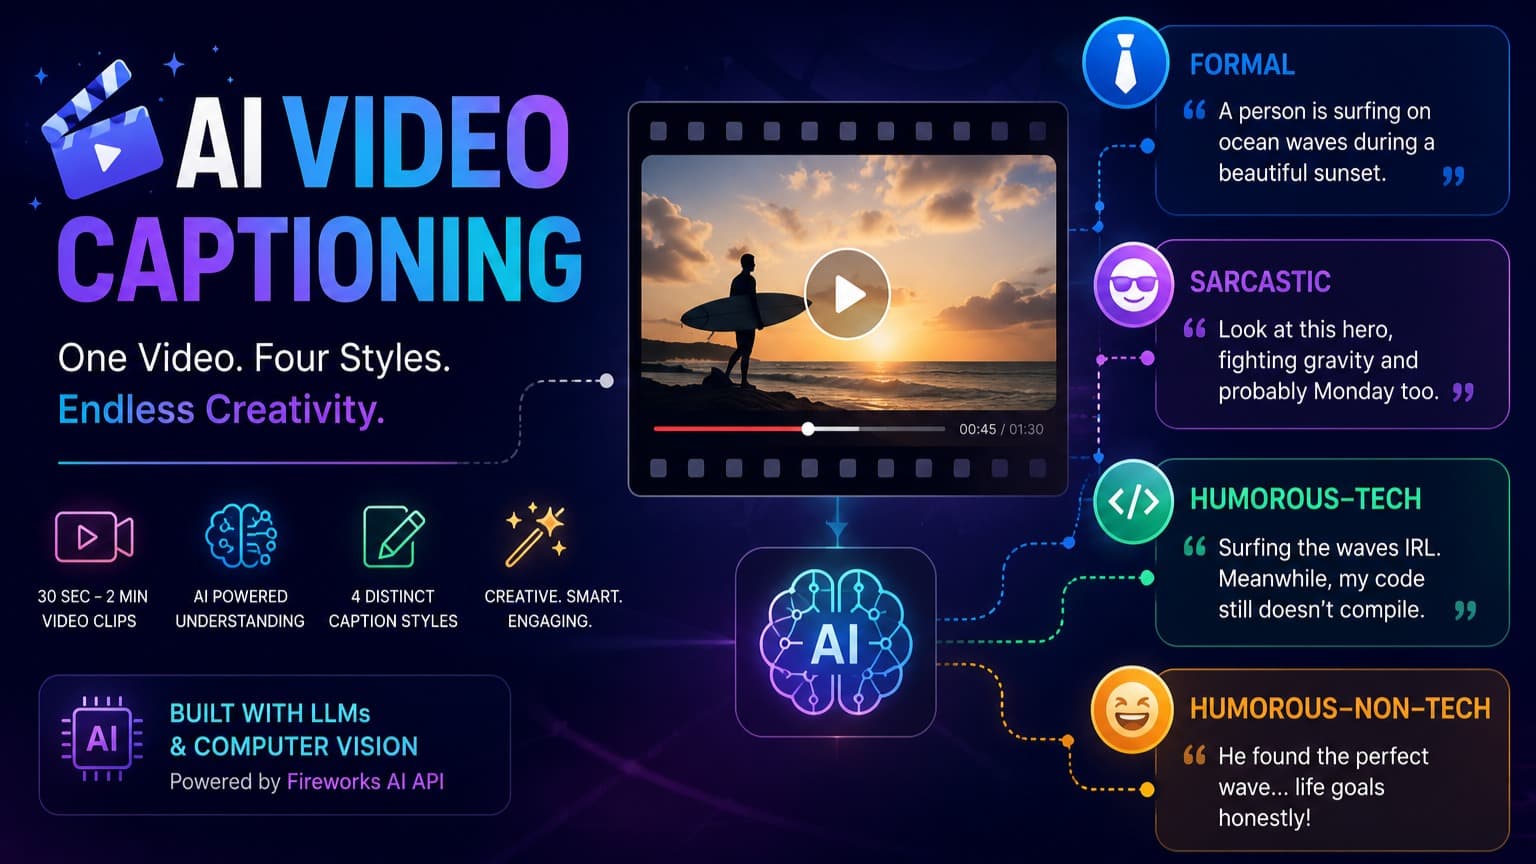
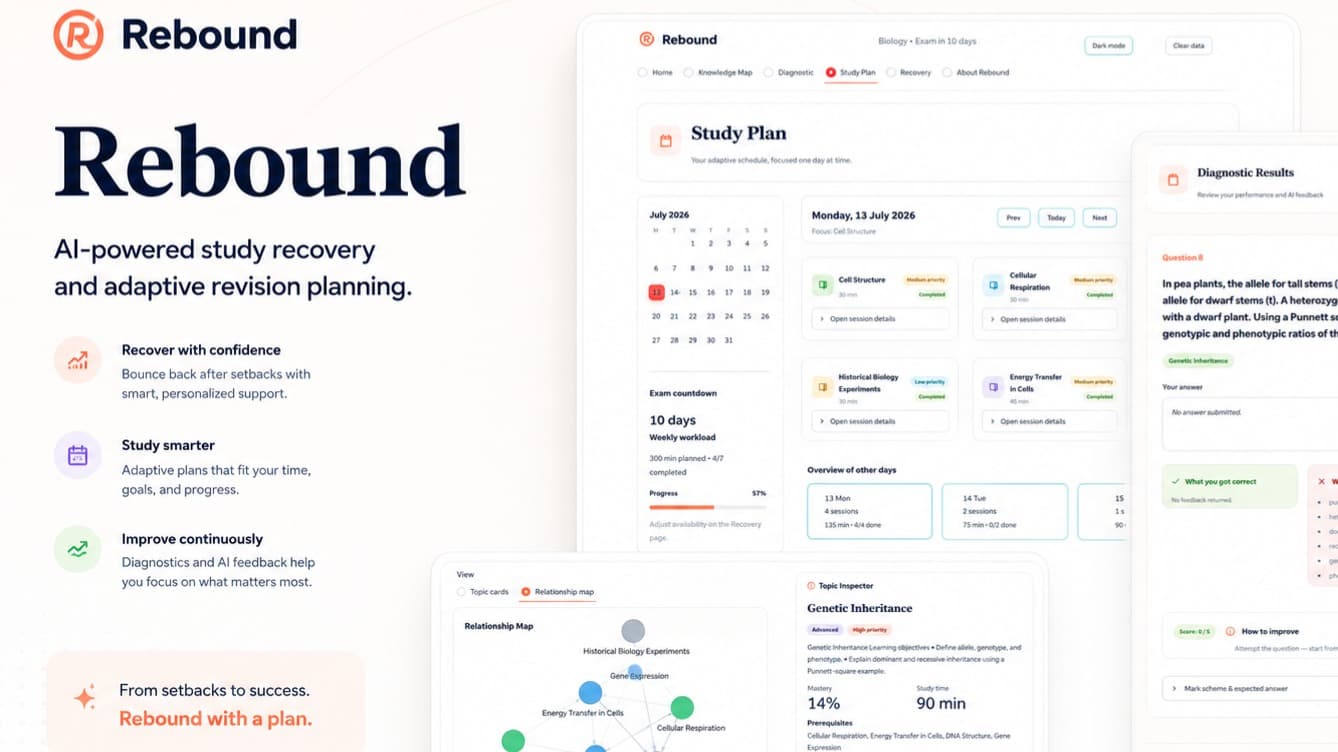
streamlit AI technology page Hackathon projects

Discover innovative solutions crafted with streamlit AI technology page, developed by our community members during our engaging hackathons.

PartnerPulse - AI powered Partner churn prediction

PartnerPulse - AI powered Partner churn prediction

Stage 1a: Batch Churn Prediction PartnerPulse begins by analyzing the full partner portfolio (~5,000 partners), engineering 60+ behavioral, financial, and sentiment-based features from the last 6 months. These include commission trends, referral activity, login behavior, support tickets, sentiment signals, and competitor exposure. A bulk ML model (HistGradientBoostingRegressor) predicts churn risk, assigns LOW/MEDIUM/HIGH risk classes, and computes SHAP explanations for the top 50 highest-risk partners—making each prediction transparent and actionable. Stage 1b: Competitive Intelligence (Parallel) In parallel, the system assesses external market pressure by measuring multi-homing rates, share of voice, and sentiment gaps. It also scrapes key competitors (PocketOptions and OlympTrade) to capture both product positioning and affiliate program structures (commissions, CPA rates, tiers). This produces a structured, portfolio-wide competitive landscape. Stage 2: Churn Diagnosis Predictions and competitive insights are combined to diagnose why each partner is at risk. SHAP drivers are mapped to five root causes: Revenue Decline, Engagement Drop, Competitor Pressure, Support Dissatisfaction, and Platform Mismatch. Each partner receives a primary and secondary root cause with weighted attribution. Stage 3: Cohort Grouping & Action Partners are grouped into cohorts by root cause, partner type, and platform. Each cohort is assigned tailored retention strategies - ranging from commission restructuring and re-engagement campaigns to competitive counter-offers or support escalation which is refined by cohort size and risk severity. Stage 4: Internal Communication Insights are operationalized through automated executive briefings, real-time Slack alerts via OpenClaw, and a consolidated CEO-level summary-ensuring churn risk translates into timely, targeted action.

Deriv Pulse - The AI Trading Psychologist

Deriv Pulse - The AI Trading Psychologist

The Problem 90% of traders lose money, often not because of poor strategy, but poor psychology. "Tilt"—the emotional state of frustration after a loss—leads to irrational "revenge trading" (increasing stakes to win back losses). Current trading platforms only show P&L; they don't see the human breaking down behind the screen. The Solution Deriv Pulse. We built a "Behavioral Risk Engine" that doesn't just track numbers; it tracks user intent. It acts as a Guardian AI that sits between the trader and the market. Key Features Real-Time "Tilt" Detection: The AI monitors stake sizing, trade frequency, and time-deltas. It flags "Martingale" patterns (doubling down after losses) instantly, distinguishing between aggressive strategy and emotional gambling. The "Pulse Score": A live psychological health metric (0-100). If you trade calmly, it stays green. If you start panic-trading, it drops to red. Active Intervention: When the score hits critical levels, the "AI Coordinator" intervenes. It doesn't just show a popup; it engages a "Cool Down" protocol, temporarily locking the terminal to save the trader from themselves. Simulation Mode: For this hackathon demo, we included a "Simulation Deck" that allows judges to inject specific high-risk scenarios and see exactly how the AI responds in real-time. Why It Matters For Deriv, this isn't just a safety feature; it's a retention engine. By preventing catastrophic account blowups, we keep users in the game longer, transforming them from short-term gamblers into disciplined, long-term profitable traders. We are solving the #1 cause of customer churn: Burnout.

DAIA - Deriv AI Analyst

DAIA - Deriv AI Analyst

DAIA (Deriv AI Analyst) is a real-time enterprise observability platform built for Deriv's business operations. It monitors Active Daily Users, Trading Volume, Regional Performance, Platform Health, and Instrument Activity, automatically detecting anomalies requiring executive attention. The system uses a 4-layer intelligence pipeline: a Correlation Engine for streaming telemetry, an LLM Reasoning Agent for contextualizing deviations, a Severity Scorer using z-score analysis, and an Executive Briefing Generator for actionable reports. DAIA operates through three Gemini-powered agents: Agent 1 (Analyst): Performs statistical anomaly detection across regions (NA, EU, APAC), platforms (Trader, MT5), and instruments (Synthetics, FX, Stocks) using rolling baselines, percentage deviations, and z-scores. Agent 2 (Reporter): Generates executive briefing reports with Market Overview, Regional Drivers, Risk Commentary, and prioritized Action Items with timelines. Reports are downloadable. Agent 3 (Advisor): Interactive chat interface for follow-up questions, root cause analysis, and investigation path exploration using live analysis data. The platform features a healthy-to-anomaly state transition. By default, the dashboard shows all systems nominal. When new telemetry is uploaded, the system processes it in real-time — KPI cards turn red, trend charts reveal drops, regional charts expose impacted areas, and an investigation path traces the anomaly from region to platform to instrument. Key features: live CSV upload with Gemini analysis, 28-day ADU trend chart, dynamic regional and instrument charts, auto-generated executive reports, and persistent AI chat for deep-dive investigation. The backend uses Python/Streamlit with 3-tier anomaly detection. The frontend uses React, TypeScript, Recharts, and Gemini API via Google AI Studio. DAIA transforms raw business telemetry into executive intelligence — turning data noise into actionable decisions within seconds.