
🤓 Latest Submissions

Surface IQ
Surface IQ is an agentic AI sales intelligence platform built on Bright Data's live web data infrastructure. A sales rep describes their ideal customer in natural language, and an AI agent autonomously sources matching companies from LinkedIn via Bright Data's Discover API, extracts decision-maker contacts from employee profiles, detects real buying signals - funding rounds, executive hires, market expansions - from live web searches, scores each account for ICP fit, and generates personalized outreach emails anchored to those real signals. Every step is fully traced and observable. Nothing sends without human approval. The entire pipeline runs in under 3 minutes for about 3 cents per run.
31 May 2026
Let's Talk Soul Food
Let's Talk Soul Food is a culturally inclusive, voice-first AI agent that conducts dietary and health profile interviews for the African American community. Powered by Speechmatics' Global English model, it accurately understands AAVE and Southern regional accents, ensuring spoken health data is captured reliably the first time. THE PROBLEM Voice-powered health apps have long failed African American users in two ways. First, traditional STT engines struggle with AAVE and regional accents, misinterpreting natural speech patterns. Second, when an STT engine mistranscribes a medical condition or dietary restriction, the downstream AI is working with corrupted data. An AI dietician cannot build a safe profile if the voice intake layer fundamentally misunderstands the user. WHY SPEECHMATICS We built on Speechmatics' Batch API with the Enhanced operating point for its superior performance on diverse conversational speech. This ensures our 7-question dietary intake loop captures culturally specific terms and regional pronunciations without introducing phonetic errors, giving our LLM the clean data it needs to generate personalized, healthy soul food recipes. TECHNICAL HIGHLIGHTS We tuned our polling loop to a 0.5-second interval, achieving a responsive 2-second conversational beat without triggering rate-limit penalties. We benchmarked Speechmatics TTS and confirmed near-zero leading silence under 85ms, eliminating dead air between turns. We implemented a Phonetic Forgiveness instruction in our LLM prompt, allowing the AI to gracefully handle minor transcription variations and correctly interpret the user's spoken intent. THE IMPACT Let's Talk Soul Food proves that Speechmatics' acoustic modeling can make AI health tools accessible, personalized, and culturally authentic for communities historically underserved by voice technology. By getting the speech layer right, every user receives the same quality of personalized health guidance regardless of how they speak.
19 May 2026
Keep Fresh Food
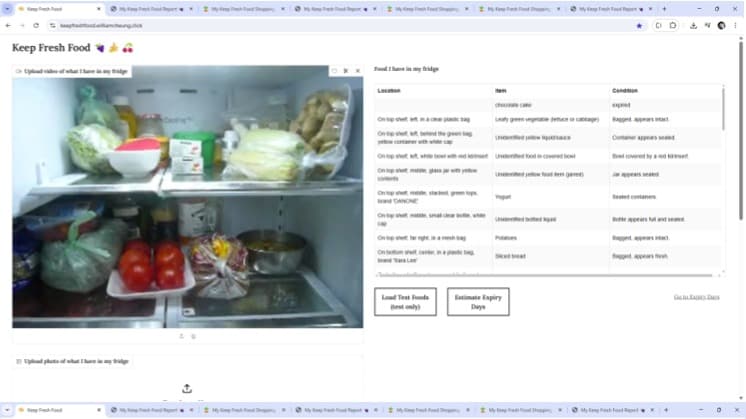
Inspired by Samsung’s new AI Vision fridges but $2500 to $3500 USD cheaper because it’s free, my awesome *Keep Fresh Food* app uses the new GPT-5 to let you take a photo or video of what's in your fridge and get the quantity and condition of the visible food and the expiry days for each food item. You can even select items that are expired or close to expired or you're low on to order from Instacart for convenient and fast delivery to your door. Home users or restaurant employees can download a nice report to keep track of the food they have and its condition and expiry on an ongoing basis. Since GPT-5 can make mistakes, you can edit, add, and delete food items shown in the app as the human in the loop. When you upload a photo of what’s inside your fridge, etc., *Keep Fresh Food* uses the vision ability of GPT-5 to accurately detect the food items with their quantity and condition. When you upload a video instead, the app uses VideoDB to detect the food items in all scenes of the video, and then uses GPT-5 to dedupe the same items appearing in multiple scenes to get a final list of unique items in all parts of your fridge shown. To help you identify each item from the list, its location in the fridge (like side door, middle shelf) and its brand if visible are included. When you choose to get the expiry days of the food items, GPT-5’s reasoning ability and recent training data are used to estimate how many days are left before each expires. If an item is a group like a bunch of bananas where one banana is spoiled and the others are fresh, then the app shows status “Attention Required” even though the expiry days for the good bananas is shown. You can then select items from the list you want to order and the app uses GPT-5 to determine the amount you can buy from a grocery store. Note: for faster performance I actually use GPT-5 Mini instead of GPT-5. When the speed of GPT-5 improves, all it takes is changing an environment variable to use the more powerful model.
24 Aug 2025
Soul Food Nouveau
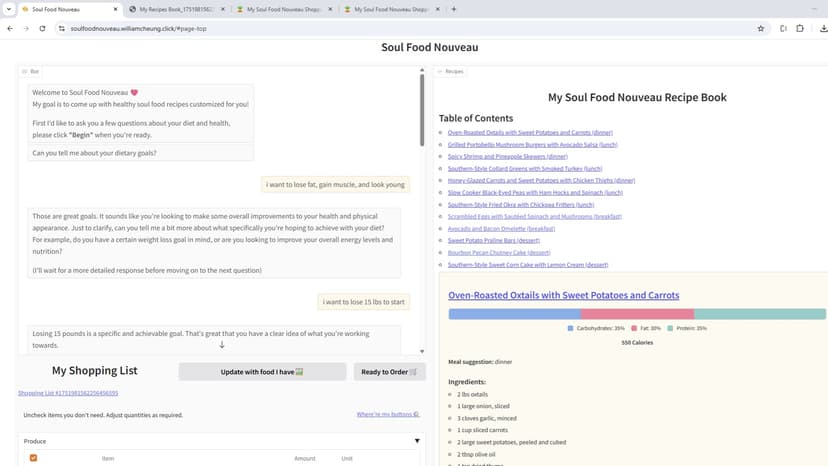
The purpose of *Soul Food Nouveau* is improving the heart health and longevity of African Americans who want to keep their unique and rich culinary tradition of soul food throughout the United States. According to www.heart.org, "The rate of high blood pressure among Black people in the United States is among the highest in the world." link: https://www.heart.org/en/health-topics/high-blood-pressure/know-your-risk-factors-for-high-blood-pressure/high-blood-pressure-among-black-people And as reported by the Houston Defender, "Soul food is a major contributor to high blood pressure in African Americans". link: https://defendernetwork.com/black-women/new-study-soul-food-is-major-contributor-to-high-blood-pressure-in-african-americans The Howard University New Service even cited: "African Americans' soul food cuisine is delicious, but it can also be deadly, according to physicians, who say it accounts for much of the annual surge in hospital emergency room visits during Thanksgiving and Christmas." link: https://hunewsservice.com/news/is-it-time-to-put-down-soul-food To address these issues, *Soul Food Nouveau* provides healthy, modern soul food recipes personalized for African American users of the app based on their individual dietary needs and health concerns, using the latest AI models provided by Groq to complement user consultations with their own physicians and dieticians. Uses of Groq: - llama-3.3-70b-versatile: user interview by dietician, shopping list generation and update - llama-3.1-8b-instant: recipe generation (meals and desserts) - llama-4-scout-17b-16e-instruct: analyze photos for food items - playai-tts: audio hints to user Recipe ingredient ordering implement using Instacart, the most popular grocery delivery service in North America.
8 Jul 2025
Health Equity Explorer
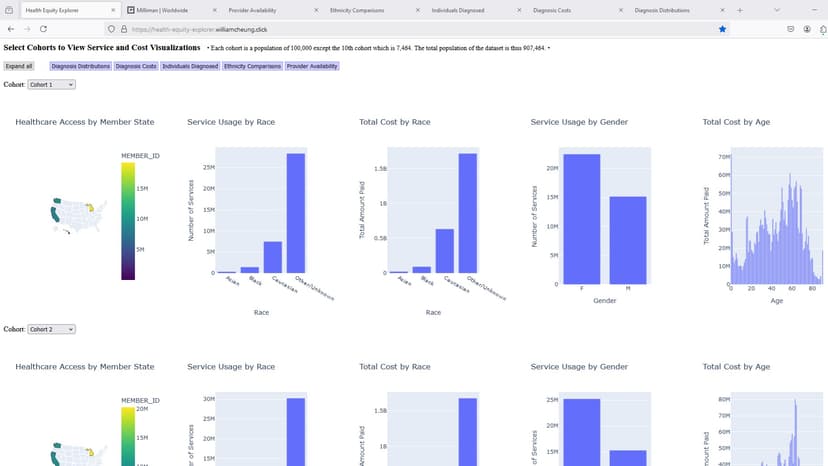
The dataset consists of 907,464 members and their associated enrollment and services data. Processing the entire dataset using Pandas and Dask on my hardware, a Dell Inspiron laptop with 16 GB RAM and 4 cores, was not possible, causing memory allocation and out of disk space errors after minutes of processing. As a result, I decided to split the member dataset into groups of 100,000, in order of parquet file name in the original dataset. I called each group a "cohort". This resulted in 10 cohorts, the first 9 having 100,000 rows, and the 10th having the remaining 7,464 rows. I then analyzed each cohort separately and generated separate HTML reports for state, race, ethnicity, gender, and age comparisons, for a total of 10 reports per cohort, plus an additional report for providers by state. The analysis for each cohort takes several minutes but now could all run to completion on my laptop without crashing. With all 10x10+1 = 101 reports generated from the analysis, I wrote a web UI to display the reports. The user can select a specific cohort by number (from 1 to 10) or can expand all 10 cohorts to see their corresponding reports, or the providers report.
11 Dec 2024


